To create a new nueral network one must first click on the "File"
menu at the top of the Main Window and then click on the "Create New
Network..." option. After clicking this menu option, the following
window will pop up:
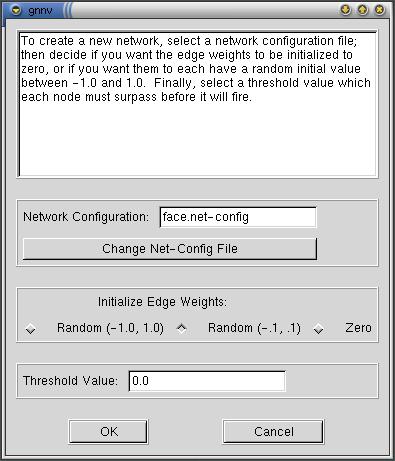
Selecting Create New Network causes GNNV to ask a series of questions
to determine what you want the neural network you are creating to
be like. This window is the first in that series.
The top part of the window contains text that helps the user to
understand the options that are available. The second part of the
window is where the user may select a "Network Configuration
File" This feature is left for expansion of GNNV. The Network
Configuration file could be used to customize the program to analyze
something other than facial features and should not concern the
average user.
The two things that the average user should be most interested
in are at the bottom of this first window: The "Initialize
Edge Weights" and the "Threshold Value" boxes.
|
|
Initialize Edge Weights:
The Initialize Edge Weights box allows the user to choose
how the weights connecting the nodes of the neural network will be set.
There are three options. The first sets the edges to random values between
-1.0 and 1.0. This provides a colorful network but makes it hard to see
the change in weights that occurs during training. The user may also set
the values to be initialized to random values between -.1 and .1. This option
is most useful for seeing the change in weights which occurs during training.
Since the values are all very close to 0 it appears that there is no weighting
in the network to start with but the values between -.1 and 1 are sufficient
for the math that the neural network uses to take place. As training happens
larger changes in the weights occur over time and the user can see the results
of training quite effectively. Examples of this will be shown later in this
document. Finally, there is the option to set all of the edge weights to
zero. This option just demonstrates that if an edge weight is set to zero
it cannot be trained because the math in the training process is based on
multiplication. The network can still answer questions when set to zero
but isn't able to do pattern recognition as effectively. This property will
be used to simulate brain damage in GNNV in the future.
Threshold Value:
The threshold value allows the user to set how difficult it is for the
nodes within the neural network to fire. What this means is that the values
being passed to a node from other nodes in the network must sum to be
at least the value listed in the Threshold Value box for the node to "Fire"
and pass the values on up to the next node in the network. Right now the
default is set to 0.0 and any values entered would have to be between
0 and 1.. Changing this value is a good way to experiment with GNNV.
|
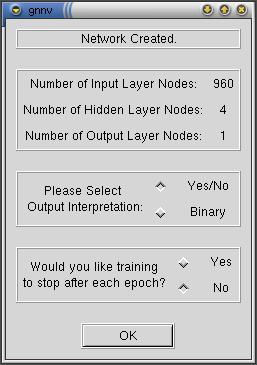
After pressing "OK" on the previous window you get the
window to the left. This window gives you feedback about the network
that has been created based on the options you selected in the previous
window.
The "Number of Input Layer Nodes" indicates that the images
being analyzed will have 960 nodes as they are 30x32 pixels in size.
The "Number of Hidden Layer Nodes" shows that the input
nodes will be filtered down through 4 nodes before going to the output
layer.
The "Number of Output Layer Nodes" indicates that 1 node
will provide the Network's answer (Yes/No) to the question posed.
The "Output Interpretation" options is another option left
for future expansion. In the future GNNV will be allowed to create
networks that have more than one output node allowing it to provide
answers to the questions it is posed through binary nodes. In other
words, it will have numerous Output Nodes and through those nodes
will be able to answer more than one question at a time.
Finally, the last option allows the user to have training stop after
each epoch for taking screen shots or doing step by step analysis
of the output.
|
|
The final window in the series of network creation windows can be
seen to the right. This is the "Attribute Selection Window."
This window allows the user to choose what attribute the user wants
the network to be looking for in the images presented. The example
window at right shows the network is going to be looking for sunglasses,
and we want to know if the image shows a person wearing sunglasses.
|
 |
The following attributes and values may be selected for the Neural Network
to analyze:
-
Userid (Which person is in the image being analyzed?)
-
Pose (What direction is the person's head facing?)
-
Expression (What expression is on the person's face?)
-
Sunglasses (Is the person wearing sunglasses?)
-
Open (No.)
-
Sunglasses (Yes.)
After selecting one of the attributes and an associated value it will show
up in the window as it has above with the format "Attribute : Value".
The user then may click the "OK" button to complete the network
creation process. Upon pressing the "OK" button the following window
will appear:
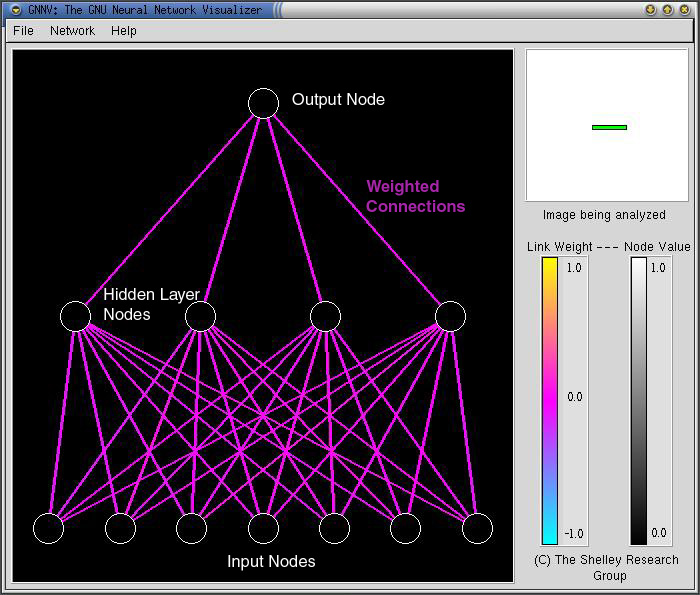
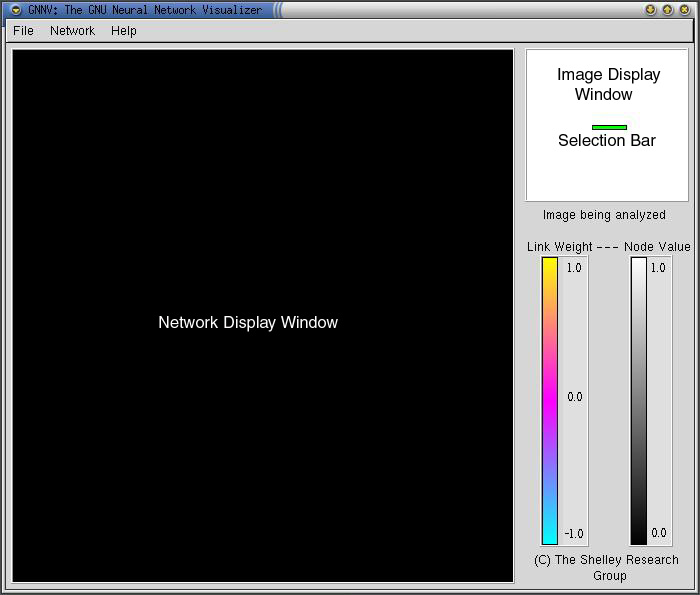
Now the Network Display Window displays a Neural Network. The main parts
of the Neural Network are labeled. The window is fairly easy to understand
with a minimum of explanation.
Input Nodes:
The input nodes each represent a pixel from the image at the top right
of the screen. In this picture above an image has not yet been displayed
and so the Input Nodes are currently blank. The pixels to be displayed in
the Network Display Window are selected by moving the green Selection Bar
over the image. Upon doing this the user is able to see the shades in the
Input Nodes change to reflect the color of the pixels that the Selection
Bar is over.
It is important to note that a perfect representation of the neural network
would actually show a flat plane of input nodes with each node connecting
to each of the 4 input nodes. Since we were unable to utilize 3D technology
in the creation of the program we have chosen to instead just display 7
nodes at a time and let the user chose which 7 pixels are displayed in those
nodes.
Weighted Connections:
The Weighted Connections are the purple colored lines connecting all of
the nodes. The color of the lines represents the importance of the connection
between the nodes. The value of the connection can be approximated by looking
at the color key to the right of the Network Display Window. As one can
see, all the weights are near 0 as the network has been initialized with
weights between -.1 and .1.
Hidden Layer Nodes:
The 4 Hidden Layer Nodes are connected to all of the Input Nodes from the
picture. The color of the nodes (Grey Scale) then changes based on the inputs
and the weights of the connecting lines that feed into the Hidden Layer
Nodes..
Output Node:
The Output Node takes weighted input from the 4 Hidden Layer Nodes and
is able to display a Yes/No answer based on what feature it is supposed
to be analyzing for the image being analyzed at that time. The user can
tell whether the network has answered Yes or No based on the Grey Scale
color in the node at that time. If the node is White the network is answering
Yes while Black means No. Shades of Grey between White and Black indicate
various levels of confidence. The more Grey the value is the less confident
the network is of its answer. This is like a human saying "Maybe Yes,
Maybe No".
The next step in using the program is to perform a training session with
the Neural Network.
Training (teaching) the Neural Network happens in much the same way that
a human is trained. A series of images are shown to the network for analysis
and a question is asked about each of the images. If the network correctly
answers the question nothing is changed which is like rewarding the network
for a job well done. If the network doesn't properly answer the question it
is punished by changing the existing weights and nodes based on how wrong
they were.
The whole training process is done automatically. The network is shown a
picture, asked a question and then rewarded or punished based on the answer.
This process is repeated for all of the images selected. One run through the
images is called an Epoch. For training purposes the network goes through
50 or more epochs to effectively train the appropriate values into the Network.
To begin a training session one must click on the "Network" menu
item at the top of the Main window. In the drop down menu select "Train
Network..." This will cause a file selection window to pop-up. In this
window one should select an image list with which to train the network. An
image list is simply a file to specify the images that we want to train the
network with. The files are named using the "filename.list"
convention. GNNV comes with a few image lists to start with and users are
encouraged to create their own personal image lists.
After an image list has been selected the Image Preview Window appears:
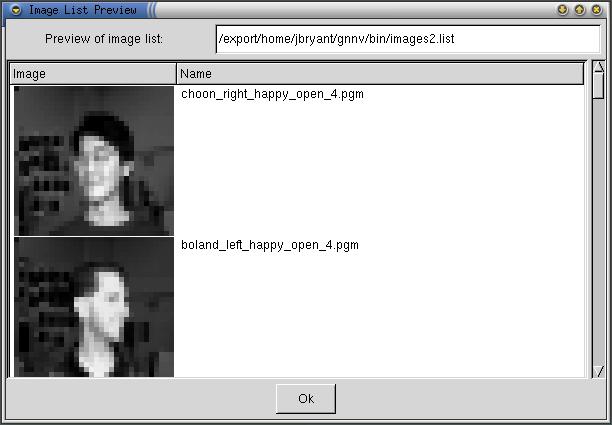
The Image Preview Window allows the user to see all the images that they
have selected to train the network upon. The Image Preview Window also displays
the filename of the image and shows the path to the image list that is being
used.
Clicking the "OK" button on the Image Preview Window causes GNNV
to begin training the network on the image list provided. An example of what
one training session looks like is shown below:
Insert epochStop animation here!
The animation above shows the change in the Neural Network over
a series of 50 epochs. As one can see the resulting network has very strong
connections between the first, second and fourth Hidden Nodes while the connection
from the third Hidden Node is more inhibitory.
A user actually sitting at a computer with GNNV loaded onto
it would also be able to see GNNV cycling through the images as it does its
analysis. The images are displayed very quickly in the Image Display Window
and the color of the Input Nodes, the Hidden Layer Nodes and the weights also
changes depending on which image is being displayed at the time and what changes
have occurred in the network's weightings from the previous epoch.
These changes in color represent the fact that GNNV is learning.
Through the process the network being asked questions and then being punished
or rewarded based on its answers causes changes in the weights and node values
of the Neural Network. As a result it is able to more effectively recognize
the appropriate pattern of information and, as a result, provide a more accurate
answer to the question it is being asked.
Confused? That is normal. Let's put this into an example that
is a little easier to understand. Picture yourself as a small child. You are
asked if a person is wearing sunglasses. You have never seen sunglasses and
therefore do not know how to answer the question. You are encouraged to take
a guess. You guess "Yes". You are congratulated for producing a
correct answer the first time. You are then shown a new image of a person
without sunglasses and are asked to guess again. You guess "Yes"
again and are scolded for providing the wrong answer. You are confused and
examine the picture more closely. Over time you would start making an association
between having a dark formation over the eyes and the answer "Yes, that
person has sunglasses on."
This is where we get to the whole purpose of GNNV's existence.
It is thought that within our brains such knowledge as what sunglasses are
and who people are is represented through nothing more than connections between
various neurons. It is also thought we learn by strengthening or weakening
some connections between neurons (The Weighted Connections) and by changing
the point at which Neurons are excited to fire (The Nodes). So, GNNV not only
shows how a computer can be taught to recognize facial features using a Neural
Network but it also demonstrates one theory for how humans are able to complete
similar tasks.
After completing the training session GNNV pops up a window
showing the results of the training session:
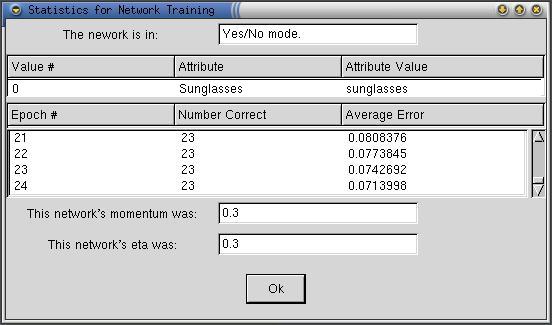
The above Training Statistics Window shows the success of the
training session that was animated above. As one can see the training was
successful. By the last epoch the network was identifying whether the person
did or did not have classes on in all 23 images. One may also see the success
of the training by looking at the "Average Error" box. The network
was only 0.0713998 or approximately 7% away from providing a perfect answer
for each of the images within the training set. The improvement can be put
into perspective by considering that the Average Error usually starts at around
50% for a new network with the network only getting one third to one half
of the images answered correctly. Also note the top of the Training Statistics
Window where the user is reminded of some of the settings that were made in
the "Create New Network" series of windows such as the attribute
selected and its corresponding value as well as the mode of the Neural Network.
We can further see the results of training the network by selecting
another image list to analyze. If we were to do this by selecting "Test
Network" from the main window one would be able to see that the network
would be able to effectively recognize whether or not the people in the different
image list were wearing sunglasses or not. The significance of this is that
it shows that the network hasn't just "Memorized" the right answers
to the images it is being shown, but rather, the network is recognizing patterns
in the images that can generalize to other image sets.
Scrolling:
Once the network has been trained the user can also click
with their mouse over the Image Display Window and move the Selection Bar.
The result is similar to what is shown below:
Insert Scrolling Animation here!
As one can see in the animation above, moving the selection
bar over the image displayed causes the Input Nodes to change to reflect
the pixels currently under the Selection Bar. One can also seen the weights
connecting the Input Nodes to the hidden layer change. The interesting thing
to note here is the difference in the amount of change that occurs in the
connections around the area of the image where the eyes are most often located
versus other parts of the image. It is hard to see in the animation above
as the change in weights is very slight when you get further down into the
network. A user sitting using GNNV, however, would be able to see this association,
especially if more training epochs were run.
The fact that stronger weights are tied to the Input Nodes
around the eyes with less activity happening further out in the image helps
to support the fact that the Neural Network has learned to recognize the
difference between a person wearing sunglasses and a person not wearing
sunglasses. This is because the increase in weights shows that the network
knows that that is the most important part of the image to analyze for answering
the question. Much like when one asks a human if another person is wearing
sunglasses they don't usually stare at the person's feet to answer the question.
The person, instead, knows to look at the person's face to gather the necessary
information.
Summary:
GNNV is able to simulate human learning by using a Neural Network to perform
pattern recognition. Users are able to select the images that they want
to analyze as well as any combination of the numerous attributes and values
that the Neural Network can respond to using Yes or No answers. The user
is able to see the progress of the network's training through the changes
that occur in the Nodes and Weights which are displayed in the Network Display
Window. After training, the user is able to explore what parts of an image
are considered to be most important to the network using the Selection Bar
in the Image Display Window. Further verification can be done by testing
the network on a different set of images. All of these functions and displays
are designed to simulate and visualize processes that may actually occur
in the human brain when related tasks occur in the real world.
This document is a product of the Shelley
Research Group.
Written by Jay Bryant ('01).
Questions or comments should be directed to:
the Shelley Research Group
Last modified: Wed Jan 31 20:08:43 CST 2001